Tuesday, August 29, 2006

How can you only have another year of a perpetual attack?

In today's column, Polly Toynbee writes that:

Tipping the boat on one side, Stephen Byers' latest assault in the Times from the Blairite extreme is outrageously provocative, demanding to cement the future long after the leader has gone. [...]  Every word Byers wrote implied that Brown is some kind of old Labour warhorse waiting to hoist the red flag in Downing Street - even though Brown has already fixed the comprehensive spending review to fall as a percentage of GDP, which hardly signals profligacy or taxing the rich until the pips squeak.

I am puzzled by the reference to the "fixed" CSR.  Gordon Brown certainly expressed in his budget an intention to limit growth in public expenditure to 1.9% in real terms, below the expected rate of growth in GDP (see, for example, here), but this is not the same as "fixing" the CSR.  Why, only last week we were being told that it was not yet set and that there would be debates up and down the country precisely on taxation and expenditure:

The comprehensive spending review will set Labour's future in cement for the next election. Before next July's deadline, Gordon Brown promises a roadshow up and down the country to expound and debate the choices in taxing and spending.
[emphasis added]

Wrote, er, Polly Toynbee last week.

Friday, August 25, 2006

What is happiness, really?

In today's column, Polly Toynbee tells us that:

it [Sweden] tops the international happiness league

Which international happiness league?  Not this one, which asks about "life satisfaction", where it is Switzerland that tops the league table.  Not this one, which is the proportion of people saying they are happy less the proportion who say they are unhappy, where it is Iceland which comes out on top.  Balnchflower and Oswald's paper "Happiness and the Human Development Index: The Paradox of Australia" (pdf link here) has Mexico in prime position.

-o0o-

UPDATE: In the comments to the piece on Comment is Free, commenter Persian says:

Polly also repeats what seems to be one of her idees fixes, namely that unlike other Europeans, Swedish women have a lot of children. From the Council of Europe's website -

Sweden’s “roller-coaster” fertility rate has received international attention. In the 1980s fertility rates grew rapidly and reached 2.14 in 1990 – one of the highest fertility rates in Europe at the time. Since the early 1990s fertility is again declining rapidly. The economic recession, increased unemployment and and less generous family policies were contributing factors. In 1999 the total fertility rate reached an all time low of 1.5 and in 2002 the total fertility rate was 1.65.

So probably Polly's not updating her facts.

The link to the Council of Europe website is here

I'm shocked.  Is she really not updating her facts?  Well, she also writes:

Nor was the "scandal" of a minister using her official credit card to buy a bar of chocolate - but she had to resign.

Gosh.  You wouldn't think that actually happened in 1995 would you?

-o0o-

UPDATE 2: The case of the "minister using her official credit card to buy a bar of chocolate", as Polly described it, gets more and more interesting.  In a paper written by two academics at Lund University, called "Pack-hunt journalism – ruthless journalism as the norm in the media society" (pdf link here) comes this description of the scandal:

After the Social Democrats’ election victory in 1994 Mona Sahlin re-entered the Government on 7 October, this time as both Deputy Prime-Minister and Minister for Equality. Almost at once she began to use her official credit card for private purposes, first for three cash withdrawals, each of 2000 SEK, then for some clothes purchases and hiring a car, and then again further cash withdrawals. After officials had spoken to her about the matter she promised to put the card away, but she didn’t pay off the outstanding debt, which totalled 9,855 SEK. On 28 December 1994 she again used the card to pay a bill of 9,187 SEK for a hired car. It was not until 6 February that she paid the original 9,855 SEK, while the car-hire bill remained unpaid, and more cash withdrawals were made (Aftonbladet 1995).

On 7 October 1995 Expressen revealed her cash withdrawals. In her defence Sahlin claimed that she had mixed up her cards. The following day she changed her story and instead claimed that it was an advance of salary. The then Prime Minister, Ingvar Carlsson, commented by noting that she had paid the money she owed. Not until 10 October did Sahlin pay the car-hire bill that had been outstanding since 1994. On 12 October it was revealed that she was still using the card, despite her promises not to use it for private purposes (Aftonbladet 1995). On the following four days all the Swedish daily and evening papers, as well as the radio and TV channels were filled to the brim with revelations about Sahlin’s various expenses and payment difficulties, including among other things that she had not paid a school bill on time. The leader columns of the Social Democratic papers criticised her, saying that she had damaged the Party.

On 16 October 1995 Mona Sahlin held a press conference [...] She made a long statement in which she accused the journalists of a witch-hunt against her. “You take pictures through the kitchen window and say she is hiding indoors […]You pry into the bedrooms with your tele-lenses. I feel dirty but I wonder how you feel, you who have been part of what I am describing […]” (Sahlin 1996: 295). [...]

At the same time the Public Prosecutor was making preliminary enquiries. And in the speculations about who should succeed Ingvar Carlsson, Mona Sahlin became more and more of an outsider. To get as far away as possible from all this fuss, she booked a holiday for herself and her family. In Mauritius. To be able to keep in touch with the Ministry, she took her secretary with her – whose stay was paid from public funds. When she came home her holiday destination was the main subject in all the headlines. In its leader on 6 November the evening paper Expressen wrote:

"The journey to Mauritius was for many yet another proof that the political classes now consider themselves above the people they represent. Not only is Sahlin behindhand in paying her bills at the play-school, while supplementing her pay with public funds, but she goes off to the millionaires’ island too. And she even has the cheek to take her secretary with her at the tax-payers’ expense."

On 10 November the pressure became too much and Mona Sahlin resigned. The Public Prosecutor then dropped his enquiry and she decided to give a first press conference. Erik Fichtelius was at the microphone. He asked whether she had now paid all her play-school bills. Yes, I think so, she replied. She thought wrong. Fichtelius said he had just checked up, and it seemed that there was still an unpaid school bill, and a reminder was on its way. Once again other media started to investigate, but eventually the media coverage died down. She returned to Government three years later and her political career seemed to pick up speed again. There the journalistic pack-hunt against Mona Sahlin might have ended. But history repeats itself.

In November 1999 it emerged that Mona Sahlin had received 98 parking-tickets in two years, of which 32 had gone to the public Debt Collector. Once again the pack-hunt set off. Scarcely a year later, in August 2000, came the next blow – the revelation that her file had been noted because she was three months late in paying a supplementary tax bill of 40,000 SEK. For Sahlin, who had launched a Social Democratic campaign under the motto “It’s great to pay taxe [sic]!”, this was yet another reminder that she didn’t practise what she preached. In case she had forgotten it, the media were only too ready to refresh her memory. In 2002 came the next media posse, when it was discovered that a double ban had been put on Sahlin’s Volvo, because she had neither put it in for its MOT test nor paid the annual vehicle tax (Molin 2002). In contrast to the first pack-hunt, however, none of the subsequent ones led to her resignation.

This was not about a chocolate bar, however much Mona Sahlin would like it to be.  From the same paper referenced above comes this quote:

She [Mona Sahlin] explained at a press conference long after the matter had been discovered that she had occasionally bought a Toblerone on her official credit card.

I think this is known as "playing it down".  It's a shame to see the gullible buying the line.

Tuesday, August 22, 2006

Mendacious figures? I'll give you mendacious figures.

In today's column, Polly Toynbee writes:

This week City dealers' bonuses soared higher than ever, to £21bn, dwarfing the £3.3bn tax take from all their inheritances.

No.  It's not just city dealers: "The ONS said the overall bonus figures cover the vast majority of Britain's companies, include [sic] bonuses to boardroom executives" says the, er, Guardian -- which also pegs the figure at £19bn.  The £21bn figure comes from this Evening Standard article, which is forecasting future bonuses and not talking about past ones.

-o0o-

Polly also writes:

Warren Buffett, giving away most of his £44bn, says: "A very rich person should leave his kids enough to do anything but not enough to do nothing."

Generous estimates of Buffet's (pre-donation) wealth do go as high as $44bn (e.g. the sometimes excitable Accra Daily Mail), though this is still comfortably below Polly's figure.  More conservative estimates have put it at around $37bn (e.g. the, er, Guardian) or about £20bn.  Not £44bn.

-o0o-

Polly also writes:

Very few ever pay inheritance tax. Just 37,000 estates paid it last year, out of 600,000 deaths. Byers bandied about the mendacious figure of 1.5 million people now caught by it, arriving at this by crudely adding up the homes of the living worth over the £285,000 inheritance tax threshold

The casual lumping together of a flow figure (37,000 per year) and a stock figure (1.5m) is disingenuous at best.  He also didn't talk about "people" but rather "properties" (source), but that's a distraction.  To see the relevance of the stock/flow issue, consider this.  If homeowners are distributed evenly across the age range of, say, 30 to 70, and they all die at 70 (yes, yes, I know I am simplifying hugely). This would mean that every year, one fortieth of homeowners would die, thereby making one fortieth of the roughly 1.5m estates with homes valued over the tax threshold liable to the tax.    One fortieth of 1.5m is about 37,500, i.e. not far off the actual figure.

Now, I am not saying that the above figures are true -- I am ignoring a lot (e.g. age distribution, particularly for ownership of expensive properties may not be even, not everyone dies at 70, etc...) deliberately -- but they do show that to compare stock and flow data you do have to understand the difference.

Calling someone mendacious for citing facts which are actually true but merely hard for the intellectually incurious to understand is a little harsh.

Saturday, August 19, 2006

A little trifle for the weekend

Polly Toynbee has been given awards and honorary degrees over the course of her career.  I read a couple of the pieces celebrating these, including this when the Political Studies Association made her Political Journalist of the Year for 2003, this when Loughborough University made her Honorary Graduand in 2004 and this when Essex University made her a Doctor of the University.

There at least two things that they all agree on.  One is that her work has "detailed presentation of fact, with careful attention to accuracy" (PSA), is "informed" (Loughborough) and "invariably well-informed" (Essex).  The second is that they all agree that she left the BBC in 1995.

How strange, then, to find her writing in 2003 that "I left the BBC 10 years ago".

Thursday, August 17, 2006

Polly maths

WARNING: this post is lengthy and detailed, and does not relate to a recent column.

Polly Toynbee appeared on Radio 4's Any Questions on the 14th July, 2006 (transcript). I would have blogged about it at the time, but I couldn't find the transcript immediately and I didn't want to rely on my memory to criticise. I did, however, stumble across the transcript on the web the other day, and discovered that she distorted as badly as I remembered. Take, for example, this exchange:

LAWSON ...The facts are these: That certainly there's been a great deal - there's been a great increase in carbon emissions over the past centenary as a result of mankind and carbon emissions - carbon - CO2, carbon dioxide, is not a pollutant, it is what plants need to grow on, it is actually a life force like oxygen. The - but the nevertheless there has been a big increase. What has happened to the world's temperature so far - over the past 100 years - and this is not in dispute, this is accepted on all sides - the temperature of - the average temperature of the world has increased by two thirds of one degree centigrade... Nevertheless, there's always a risk that carbon dioxide emissions may contribute more, they've contributed something to this two thirds of a degree and therefore it is sensible to take out an insurance policy and may be nuclear power is a sensible insurance policy to take out.

CLARKE Polly Toynbee.

TOYNBEE Well I find that very interesting I think Lord Lawson is one of the last of a very rare breed that perhaps we ought to be protecting. He is a climate change denier. And there are almost none of them left. I used to get loads of e-mails and loads of correspondence on this from various scientists all over the world and they have all shut up and gone away, except for Lord Lawson. There is virtually nobody and certainly no reputable scientist left and even George Bush has had to face up to the unpalatable truth that global warming is certainly happening and we are to blame.

So, Lawson says that there has been a rise in CO2 emissions, says that there has been a rise in temperature and that the CO2 emissions have "contributed something to this two thirds of a degree", and he is branded a "climate change denier"? What? It almost feels like a prepared rant rather than a reply to what Lawson actually said.

-o0o-

But that's not what I wanted to write about. On Any Questions, Polly made the following claim:

[T]he figures show that if you take a very clever very poor child at the age of 22 months and you compare them with a very dim but well off child at 22 months, there they are at opposite ends of the spectrum, by the time they're six years old they will have crossed over and their trajectories will go in opposite directions.

It was a claim which intrigued me at the time, and I was reminded of it when I re-read the transcript. So I did a little bit of digging. Polly wrote this on 22 January, 2003:

Take babies tested for attainment at the age of 22 months: at one end of the scale is a very bright child from a poor home and at the other end is a dim but rich baby. At just under two years old, the bright child scores 85 points on the scale while the dim one scores only 10. But the two children are already on a steep trajectory in the opposite directions, the poor/bright one travelling fast downwards, the rich/dim one moving up, as their social backgrounds counteract their inborn abilities.

By the time they hit nursery school, at the age of three, they have nearly converged - (poor/bright scores only 55 now, while dim/rich has risen up to 45). At the age of six the children's lines cross, and then diverge for ever more as they head off into opposite futures. Anything that happens by the time they reach school is only remedial, seeking to pull up the poor child's scores to where it began.

On 3 June, 2003, she wrote this (and some of this may seem familiar):

Take babies tested for attainment at the age of 22 months: at one end of the scale is a very bright child from a poor home and at the other end is a dim but rich baby. At just under two years old, the bright child scores 85 points on the scale while the dim one scores only 10. But the two children are already on a steep trajectory in opposite directions: the poor/bright one travelling fast downwards; the rich/dim one moving up, as their social backgrounds counteract their inborn abilities. By the time they hit nursery school aged three, they have nearly converged - poor/bright scores only 55 now, while dim/rich has risen to 45. At the age of six the children's lines cross, and then diverge for ever more as they head off into opposite futures.

So anything that happens by the time they reach school is only remedial, seeking to pull up the poor child's scores to where it began.

On 3 September, 2003, worried that her readers may still not have tired of the wonders of the copy-and-paste function of her word processor, she writes:

He [David Bell, chief inspector of schools] quotes influential research from Dr Leon Feinstein of the LSE, whose findings electrified the education ministers. Testing babies for attainment at the age of 22 months, their progress was followed according to social class. It found very bright children from poor homes and dim but rich babies at the other end of the scale were already on a steep trajectory in the opposite directions, the poor/bright travelling fast downwards, the rich/dim moving up. By nursery school at three, they have nearly converged. At the age of six, the children's lines cross and then diverge for evermore as they head off into opposite futures.

So the rest of school is just remedial to repair early damage already done.

We're given a bit of a respite until 2 April, 2004 when, the meme is shortened down to:

A baby's fate is virtually fixed at 22 months: school is too late.

These have all been from the Guardian, which at least has the merit of a voluntarily paying readership who can stop buying the paper if they tire of buying endlessly recycled prose. That is not true in the case of a pamphlet she wrote for the Mayor of London (pdf link here), where she wrote:

Take a very bright poor child at the top end of the ability scale and a very dim well-off child at the bottom end of the scale at the age of 22 months and test them again as they both reach nursery school at the age of three: the poor/bright child will have slipped far down the ability scale while the rich/dim kid will have risen up it. They are both on a steep trajectory in opposite directions, the bright/poor downwards, the dim/rich upwards. At the nursery school gates their scores converge. By the time they reach the age of six in primary school the children’s lines cross, with the rich/dim heading on upwards and the poor/bright one falling back as they head off into opposite futures for ever more. Any schooling thereafter will only offer remedial help for the damage done to the poor child in the earliest years.

According to Ken Livingstone, this article cost about £7,000 -- and the tendering was not competitive (source). The next time Ken decides to spend tax money I contributed towards to copy and paste bits of old Guardian articles together, I will undercut £7,000 as a fee. But then again, I don't write things like:

This week Ken Livingstone has shown how real bravery in the face of near-universal attack and predictions of disaster is winning through on London's congestion charge.

in a national newspaper, so maybe my back doesn't need scratching quite as much as hers.

-o0o-

But what of the actual research? Well, it is inaccurate précis of an article by Leon Feinstein published in the Feburary 2003 issue of Economica, entitled: "Inequality in the Early Cognitive Development of British Children in the 1970 Cohort". I haven't found a free copy online, but it can be purchased through the Social Science Research Network (www.ssrn.com). [UPDATE: See comments for a link to a free version of the pdf. Thanks, Chris.]

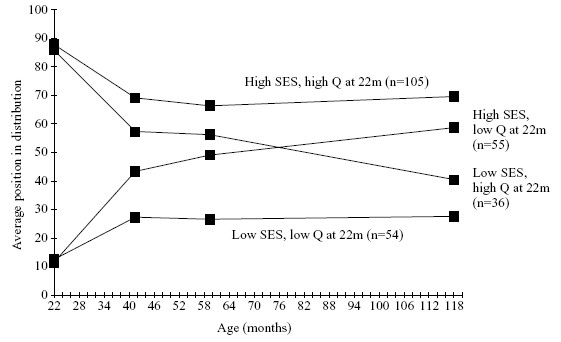
Here is figure 2 from the article, which is what Polly is trying to summarise:

Where "High SES" means that the child's parents had high socio-economic status (i.e. "father was professional/managerial and mother was similar or registered housewife") at the time of birth, "Low SES" means the parents had low socio-economic status (i.e. "father in semi-skilled or unskilled manual occupation and mother similar or housewife") and "Q at 22m" refers to the child's quartile in tests carried out at 22 months. "High Q", then, means that the child was in the top quarter of children tested at 22 months.

On the face of it, then, you can see why Toynbee characterises it the way she does -- it does appear to suggest that "rich/dim" kids do overtake "poor/bright" ones at between six and seven years (assuming the trend lines are indeed linear).

However, here are four big things that Polly does not tell you about the resarch.

ONE It is carried out on children born in 1970. That's right -- it is measuring what happened over thirty years ago.

TWO When she talks about dim and bright kids at 22 months, she doesn't tell you what is being measured. I will. Here is the questionnaire (pdf link, sorry) that was used in the research. Here are some of the things that were measured:

  • Can he balance on one foot for one second?
  • Can he jump in one place?
  • Can he put on his pants?
  • Can he draw a vertical line?

Now, I'm not for one second suggesting that these are not broadly reliable indicators of general development but to call a kid who cannot balance on one foot for one second at the age of 22 months "dim" is pretty hypocritical of someone who complains that failing the 11+ made her feel that:

I was judged on that day and I was found stupid. And I was very lucky, I was middle class for a start which meant that I was likely to get a leg up in life, unlike lots of children who were dammed forever by that exam, quite unfairly and quite wrongly. [source]

THREE Polly shortens the comparison of socio-economic status to "rich" versus "poor". In fact, it is not clear that it is the socio-economic status which is making the difference. In fact, Table 3 in the Feinstein article shows that the background variables at birth (parents' socio-economic status, parents' schooling, number of siblings, sex, and mother's age) account for only 25% of a child's ranking in tests carried out at 10 years of age.

Furthermore, socio-economic status is quite a small part of that. If you were born in 1970 and your father's socio-economic status was low (3, 4 or 5), this cost you -7.2 percentiles in your test score ranking at age ten. Having an older sibling would have cost you -8.9 percentiles and two older siblings would have cost you -13.9 percentiles.

In other words, having two older siblings damages your test score results at age ten almost twice as much as having a father of lower socio-economic status.

Oh, and the single biggest thing that makes a difference is having a mother with a degree. This boosts your test score results at the age of ten by +25.2 percentiles.

Why is this important? Well, let's not forget that Polly argues for specific policies and uses the "facts" that she cites to support these. In the her article of 2 April, 2004, for example, she uses it to argue for an "increase in the top rate of tax", because poverty causes poor school results. That this might have been true thirty years ago, and that even then the explanatory power of parent's socio-economic status was relatively low is actually quite helpful context to allow us to judge the quality of her policy prescriptions.

FOUR Polly wrote that:

A baby's fate is virtually fixed at 22 months: school is too late.

No. Table 4 of Feinstein's article shows that of the children who were in the bottom quartile of test results at age 22 months, 32.3% went on to get A-levels or higher qualifications, compared to 43.3% from the top quartile. Doing badly in a test of jumping in one place aged 22 months is not tantamount to failure.

Tuesday, August 15, 2006

Re-commissioning

Today's Polly Toynbee column has lots of broad assertions of opinion rather than poorly-researched facts.  However, this sentence is particularly troubling:

A new Commission on Integration and Cohesion, launching this month, will be worthless unless its first recommendation is to end religious and ethnic segregation in schools.

The commission is anything but new.  Charles Clarke announced it in September 2005 (source), at which time there was a lot of detail.  It would have public meetings round the country, chaired by a government minister.  A report was promised in July 2006.  Clarke wrote to "faith leaders" to ask their opinions.  The CRE published a response to the consultation in October 2005 (source).  By May of 2006, however, a commenter on Comment is Free was wondering what had happened to it (source, comment 32002).

And now (well, in June 2006) it is re-launched (source).  It may now have a chair, but new it is certainly not.

Friday, August 11, 2006

Allergic even to the word 'research'

In today's column, Polly Toynbee writes:

The Institute for Public Policy Studies says migrants are profitable: for every £100 in taxes paid by the average British-born person, the average new immigrant pays £112. Migrants make up only 8.7% of the UK's population but pay 10.2% of its income tax.

I think she means the Institute for Public Policy Research -- their press release with these figures is here.  I have often chided Polly for failing to source facts and figures she uses.  It is encouraging to see her try to do so here, but it remains a case of high marks for effort; low marks for accuracy.

A recurring theme of Polly's piece is that migrants pull down wages.  So, for example, she argues that:

Even if GDP grows, migration can make the rich richer and the poor poorer. London, where migration is greatest, also has the highest unemployment, especially among British-born ethnic minorities. Poor families in this most expensive city can't pay for childcare, and compete for jobs with single migrants willing to take less than a living wage. But the rich prosper: restaurants, cleaners and all other services are cheaper because wages are low.

The argument suffers a little, as the IPPR figures on tax make clear that migrants tend to earn more than the average British-born person, and not less.  Indeed, the IPPR report behind the press release (pdf available here) shows that in 2003/4, the average gross weekly earnings from main job of working-age migrants was £405.83, compared with £355.06 for someone born in the UK.  To quote at length from page 7 of the IPPR report:

UK and foreign-born populations have slightly differing distributions of income. Immigrants are overrepresented at the upper end of the income spectrum. For example, some 4.7 per cent of the foreign-born working age population earn more than £1000 weekly compared to only 2.6 per cent of the UK-born. At the other end of the wage spectrum, where both immigrants and non-immigrants are more concentrated, there is a slight difference in the relative distribution. For example, at the very bottom end of the distribution, 12.8 per cent of UK-born earn less than £100 a week compared to 9.7 per cent of foreign-born. It is also worth mentioning that employment rates amongst immigrants are lower than those of non-immigrants (due in part to the fact that many foreign-born are students at British educational institutions)...

Tuesday, August 08, 2006

New terms

In today's column, Polly Toynbee writes:

He [Blair] has upped Britain's pledge in a tougher carbon trading regime for the second EU round. But since 1997 UK emissions are up 3%.

If you look at National Statistics' Environmental Accounts Spring 2006 (pdf link here), and in particular table 2.3, you'll see that in 1997, the UK's total emissions of greenhouse gasses were 754,793 thousand tonnes, and in 2004 731,915 thousand tonnes. 

A, ahem, fall of 3%.

-o0o-

She also writes that:

We have the dirtiest cars and the most expensive public transport.

Compare that to this quote, from a Friends of the Earth press release (source):

According to the RL Polk data, the UK has the fourth highest average emissions from new cars in the 15 member states covered by the agreement. The highest average emissions are in Sweden (193.7 g/km CO2) and the lowest in Portugal (145.1 g/km CO2). UK emissions are slightly lower than those in Germany (170.8 g/km CO2) and substantially higher than those in France (151.9 g/km CO2).
[emphasis added]

Saturday, July 29, 2006

Better or Worse? p.54

With no columns in the Guardian this week, there has been little Polly Toynbee output to factcheck.  So I turn once again to Better or Worse? Has Labour Delivered?, the book Polly co-wrote with David Walker.  The challenge is to open it to a random page, and try to find a factual inaccuracy.

On page 54 (my edition is a Bloomsbury paperback), Polly writes:

In 2003 the child of a father in the lowest social classes was twice as likely to die within a year of birth, five times more likely to die in a road traffic accident and fifteen times more likely to die in a house fire than those in the highest social class.

The sentence bears a truly striking resemblance to one from page 9 of a 2004 report from the Institute for Public Policy Research, written by Will Paxton and Mike Dixon (you can download a pdf version of the report from the Guardian's website here):

The list of disadvantages which are correlated with poverty is long, but to give just a few examples: in 2003, children of fathers in the lowest social class were twice as likely to die within one year of birth (ONS 2001), five times more likely to die in a traffic accident and 15 times more likely to die in a house fire than those from the highest social class (DoH 2003).

As I say, the similarities are startling, and for those interested in this sort of thing, the IPPR report is dated 2004; and Polly's book is dated 2005.  I'm going to assume it is Polly who was handy with the copy 'n' paste.

But the differences are striking too -- for example, I'd always assumed the absence of sources from Polly's material was just laziness, as opposed to deliberate suppression.

And, as ever, going to the original sources is revealing.

The figure about children from social class V being twice as likely to die within one year of birth than those from social class I is taken from an ONS report  called Childhood, infant and perinatal Mortality statistics - Review of the Registrar General on deaths in England and Wales, 2001 (pdf link here -- see Table 20) which was published in 2003, but actually refers to 2001. 

By the time the 2003 figures had come out in 2005 (pdf link here -- again see Table 20), the ONS had moved from a five-class categorisation of social class to an nine-class one (counting 1.1 and 1.2 as two separate classes).  As a result, the chances of dying before one in the top social class (1.1) was 0.32%, and the equivalent chance in the bottom social class (8) was 4%.  A tenfold difference and not a twofold one.

As for the figure about dying in traffic accidents and in house fires, the report that Paxton and Dixon cite, Tackling health inequalities - 2002 cross-cutting review, was actually published on 19 November 2002, according to the page on the Department of Health website from which it can be downloaded (here).  Therefore, the quality of its insights into causes of death in 2003 are likely to be limited.  In fact, the closest it comes to sourcing its claim that "[r]esidential fire deaths for children are 15 times greater for children in social class V compared to those in social class I" is on page 48, where it makes clear that the data it is using cover 1989-92.  Rather than 2003.

Friday, July 21, 2006

She would bet on it

In today's column, Polly Toynbee writes:

Cowardice often hides behind "globalisation" as an excuse for inertia. Often it is the Americans who puncture the convenient myth of the helpless nation-state. Here's the latest example: the US senate is about to outlaw online gambling by preventing credit cards and banks paying out to gaming sites...  The US shows you can just ban the banks from paying any money to online gambling sites at home or abroad, so this lethal explosion can be stopped.

Actually, it is not clear that the US senate is about to outlaw online gambling.  As this article in the Washington Post shows, there is disagreement  among Senate Majority Leader Bill Frist's aides about whether this will happen before their August recess.  And, of course, it actually needs to, er, pass the vote.

And it does not show that "you can just ban the banks from paying any money to online gambling sites at home or abroad".  There are rules governing trade (that pesky "globalisation" stuff).  Appeals have already been lodged with the WTO (source), and the US does not have a 100% record with the WTO over gambling legislation (source).  It is also possible that this episode will show  that you can't just ban banks from paying out to online gambling sites at home or abroad.

And, of course, it is still too early to say what the effect of the legislation will be (if it does get passed, and it survives challenges by the WTO, that is).  It may, or may not, stop this "lethal explosion".

For someone who condemns gambling, she's taking a heck of a punt.

Tuesday, July 18, 2006

Still unclear

Today's Polly Toynbee column says:

The eyes of would-be nuclear builders, meanwhile, are on Areva, the French government- subsidised company building in Finland the first new nuclear station anywhere in decades.

It might be instructive to compare that with this, from a column in the Guardian from August 2004:

Nuclear has, however, found an important niche market in Asia. Of 27 stations now under construction worldwide, 16 are in China, India, Japan and South Korea. China and India both intend at least to quadruple their nuclear output and have started nine new power plants in the past four years and have 10 more under construction.

Ahem.

Friday, July 14, 2006

Fun ding-dong

In today's column, Polly Toynbee says:

Party fundraising did for Chancellor Kohl, the man who united East and West Germany at great political and financial risk

Actually, the scandal broke in 1999 (source), over a year after he was 'done for'.  He lost a general election in 1998, when the issue wasn't at all current (source).

-o0o-

Polly also says of the Tories' proposed cap on donations of £50,000 that:

The unions this week gave indignant evidence that the cap would cut their annual contribution to Labour from £8m to £800,000.

Actually, these figures refer only to affiliation fees and not the total contribution, as this article in the Guardian makes clear:

The proposals would mean the unions, Labour's chief source of funding, would only be able to provide £800,000 annually instead of the present £8m annually in affiliation fees alone.
[emphasis added]

Indeed, a bit of digging on the part Electoral Commission's website dedicated to funding (here) shows that in 2005, unions gave the Labour Party £11.8m in cash alone, of which £2.8m was in donations below the proposed cap of £50,000 (though some of these may be multiple donations from the same union).

Thursday, July 13, 2006

Recidivism

A little bit more on Tuesday's Polly Toynbee column.  As ever, actually taking the time to go back and read the source material has cast her gift for inaccurate précis into sharp relief.  Take this quote from her column:

Crime Concern delivers many of those designed to draw in the children regarded as at highest risk of offending. On a Rochdale estate, it achieves a 70% fall in calls to the police complaining about young people. It cost £350,000 - but researchers estimate it saves £665,000.

The £350,000 vs. £665,000 comparison comes from an evaluation of the Community Merit Awards (CMA) programme, commissioned by the Youth Justice Board (pdf link here).  The figures do not refer to Rochdale, but to all CMA programmes (see p.13 of the report referenced above), and the efforts in Rochdale include a lot more than just the CMA, as this quote from page 12 of the report illustrates:

The Langley YIP is engaged in a number of other schemes, so it is difficult to give all the credit to the CMA

In other words, the "It" in "It cost £350,000 - but researchers estimate it saves £665,000" does not refer to anything mentioned previously in the column.

As for Polly's "[o]n a Rochdale estate, it achieves a 70% fall in calls to the police complaining about young people", the report is a little more nuanced:

For example, the positive view of the young people provided by wardens in Langley, Rochdale was backed up by the estate’s housing manager. He stated that, at a recent borough-wide meeting to discuss vandalism and anti-social behaviour, his was the only estate where these issues were not seen as a problem. He also estimated that calls regarding young people being a nuisance had fallen by 70% during the CMA scheme.

In other words, an estimate of calls (not necessarily to the police) by the estate's housing manager.  For an actual figure, I commend to you the Middleton Guardian's story "‘It must be YIP’ as youth crime halves", which says:

Between April and June youth nuisance calls have fallen by 41 per cent, with criminal damage down by 60 per cent. Areas not covered by the project have not reflected the reduction in trouble.
[emphasis added]

In other words, an excellent result, and one to be praised, but not the one Polly claims.

-o0o-

She then goes on to say:

The youth inclusion programme identifies the 50 children most likely to become offenders locally, achieving a 65% reduction in arrest rates

The 65% reduction in arrest rates among participants needs to be compared with a 44% reduction in the control group of "top 50" children most likely to become offenders who weren't included in the program.  On page 100 of Evaluation of the Youth Inclusion Programme (pdf link here), for example, comes this quote:

There was also a decrease in the levels of offending for the top 50 who were not engaged by the projects. However, the change was substantially lower than for those engaged, at 44% compared to 65% for those that were engaged

Again, a 21% reduction is a laudable result, but not the one claimed.

-o0o-

Polly also writes:

Home Office research shows that every 15% increase in incarceration only prevents 1% of crime.

Of course it doesn't.  Take, for example, page 130 of the 2000 Halliday Report - 'Making Punishments Work: A Review of the Sentencing Framework for England & Wales' (pdfs downloadble from here) which says:

Home Office modelling suggests that the prison population needs to increase by around 15% to result in a short-term reduction of crime of just 1%, assuming that the extra prisoners would have committed 13 recorded offences per year, if at liberty.

Now, these figures only try to calculate the number of crimes that would have been committed by the new prisoners, or to quote Halliday:

These figures represent the avoidance of crimes, arising from just imprisoning a person. They do no [sic] estimate the effect on the propensity to commit crime after their period of imprisonment or the deterrent effect on others.
[emphasis added]

And how about the assumption that "extra prisoners would have committed 13 recorded offences per year, if at liberty"?  Well, Halliday gives this as a basis:

A survey of self reported offending among males received into prison under sentence in early 2000, suggests that they commit offences at around 140 per year in the period at liberty, before they were imprisoned.

[From the footnotes] It is estimated that the self reported offending figure of 140 is equivalent to about 13 recorded offences per year

[Back to the main text] There are substantial differences in the extent of drug related offending, ranging from 22 offences per person per year for those not taking any drugs to 257 for those who take drugs and admit to their drug taking being a problem.

Or, in other words, you can be more selective about whom you incarcerate.  To quote Halliday again:

A 1% reduction in recorded crime can be achieved by targeting particular groups, but with a smaller overall increase in the prison population. For example, by increasing by 16% the prison population of persons who admit to taking a drug and to their drug taking being a problem. This is equivalent to a 7% increase in the overall prison population.

Or a 15% increase could achieve about a 2% reduction.  So it is not true that "every 15% increase in incarceration only prevents 1% of crime." [emphasis added]

-o0o-

The poor "every 15% increase in incarceration only prevents 1% of crime" citation is used as evidence for this sentence:

Prison is swallowing up the cash that might stop crime - and it doesn't work.

Now, the prison population is about 76,266 (source here -- not particularly up-to-date, but good enough for a rough and ready calculation).  The research Halliday cited claimed that each prisoner would have committed or taken part in  about 140 offences a year if at liberty, thus preventing 10.6m offences from occurring.  The budget for the prison service is about £2.8bn (£2,591m of current and £209m of capital expenditures. Source: Home Office Departmental Report 2004–05, pdf link here, p.124-5), which means it costs about £264 per offence prevented.

Separately, the Home Office has estimated that the average cost of a crime to society is about £2,000 (on page 4 of Home Office Research Study 217: The economic and social costs of crime, pdf link here, they talk about "16 million crimes were estimated to be committed in this category each year, at a total cost of around £32 billion."  Note that this is for crimes against individuals and households only).  This estimate includes the costs of the Criminal Justice System, so we'll strip these out to avoid double-counting.  These amount to about 20% (see p.55 -- note this is for the entire CJS, not just the prison service, so we are being conservative in our estimates here), so say the average cost per crime is £1,600.

Now, this is a back of the envelope calculation, and certainly not rigorous to make any policy recommendations as a result (e.g. it is not clear that all 140 offences would not occur, as some of them were committed with other people), but it is not immediately apparent that "[p]rison is swallowing up the cash that might stop crime" -- it looks like it is spending cash that does stop crime -- £264 per crime prevented, which would have cost £1,600 had it occurred.  (Here is where I got the idea for the calculation).

Tuesday, July 11, 2006

Let me count the ways

In today's column, Polly Toynbee writes:

The Audit Commission estimates that £42,000 on effective early interventions in children's lives from birth to adolescence spares £153,000 in incarceration.

There are a number of problems with this sentence, and here is a guide to them:

The Audit Commission estimates(1) that £42,000 on effective early interventions in children's(2) lives from birth to adolescence spares(3) £153,000(4) in incarceration(5).

(1) It should actually be "estimated", not "estimates".  When Polly first wrote about this back in March 2004, she actually had the good grace to use the past tense of "estimated".  Now, over two years later, writing about exactly the same thing, we've suddenly switched to the present tense.  Eh?

Oh, and if you doubt that it is the same thing, here is a sentence from her 2004 article [empahsis added]:

The commission estimated that spending £42,000 on early interventions from birth through adolescence would spare £153,000 on subsequent incarceration.

It is eerily familiar, isn't it?  Apart from the altered tense...

(2) "Children's lives".  Guess the sample size on which this broad generalisation isbased.  No, go on, guess.  It is one.  One!  And hardly a representative one either.  If you read the original research and their description of James (name has been changed), you'll see that:

  • James is 15.
  • He lives in his mother’s house; however, she is rarely there.
  • His older step-sister is also living there. She is a known drug user with previous convictions.
  • His father occasionally visits and is violent and disruptive when he does.
  • James has been excluded from special school.
  • He is not receiving any alternative educational provision.
  • He was ten when he received his first caution.
  • He is currently serving his second custodial sentence.

I would hesitate to draw broad conclusions about "children's lives" based on one example, and on this one in particular.  And the Audit Commission did not try to.  In fact, they speculated about the benefits of spending on early intervention in a particular child's life.

(3) The word "spares" here suggests that spending the £42,243 would automatically save the £153,687.  Of course that is not guaranteed on the basis of a counter-facutal involving one person.  Which is why in their research the Audit Commission uses phrases like:

"assuming crime route is avoided" [emhasis added]

"It is not possible to accurately estimate the costs of a young person’s involvement in crime and the impact on the lives of themselves and others."

"Had the services been available, James might have benefited from family support, pre-school education, anger management, learning support and mentoring." [emhasis added]

This is not to say that early intervention programmes don't work, but rather that the claim that they can save so much is pure conjecture.

(4) The actual figure is £153,687, so even with rounding this should be £154,000.

(5) No.  Look at the original research.  The £153,687 does not refer to incarceration alone.  It includes a special education needs assessment by the LEA, compiling an education 'package', social services undertaking a family assessment, and so on.

Friday, July 07, 2006

Hard figures

In today's column, Polly Toynbe writes:

The Work Foundation points to these hard figures: in 1980 top directors in FTSE companies were paid 10 times the average worker in their companies. By 1990 the gap had multiplied to 31.5 times. And by 2002 the top dogs were paid an enormous 75.7 times more than their average employee. It is a statistical and social impossibility to pretend that we can really abolish child poverty in a society shaped like that.

It has not been easy trying to find the source of these figures (the Work Foundation merely "points" to them).  The best I can do is an article called "Corporate governance and disappointment" in the Review of International Political Economy 11:4 October 2004.  I haven't found it on the web freely available, but you can buy a copy here.

From this, we learn that it is not all FTSE companies, it is FTSE-100 companies.  The data refer to the highest-paid individual director in each of the FTSE-100 companies.  And it is not "the average worker in their companies", rather it is the average of "full-time manual employees in the UK." [emphasis added, source is the article I mentioned above].

Now, the average of all manual workers pay is different from the average pay of people working in a FTSE-100 company, as I am sure the employees of, say, 3i or Barclays or Schroders will be able to confirm.

When Polly called these "hard figures", I initially assumed she meant tough or rigorous, rather than difficult to get right.

-o0o-

Even more interesting, though, is the 'why can't we be more like Sweden?' meme.  In the paragraph directly after the authors of "Corporate governance and disappointment" introduce the figures which Polly makes a half-hearted attempt at citing, they say:

The US/UK differences are interesting but it is a mistake to make too muchof them or to assume that by the late 1990s large payouts to executives were limited to Anglo-Saxon, stock market-based economies... As Messier at Vivendi or Barnevik at ABB demonstrate, greed knows no boundaries and consequently some of the most interesting examples of excessive compensation have arisen in the most unlikely places. As Business Week (19 May 2003) observed of the Swedish/Swiss ABB, ‘for a staid engineering company, they sure know how to make a golden parachute’.

Or could it be that there is scant causal link between directors' pay and child poverty?

Tuesday, July 04, 2006

Eh, quality?

In today's column, Polly Toynbee asks for an:

open discussion about the danger of infinite inequality escalation.

And she probably is looking for something more sophisticated than "it's OK, it is by definition finite."  So let's get into the facts.  Polly writes:

In personal property and liquid assets, the top 10% owns half of everything. The bottom 50% of the population owns just 6%. Count liquid assets alone, and the top 1% owns 63% while the bottom half owns just 1%. And this wealth inequality is growing fast, year on year.

Read that, and you might be surprised to learn that in in 1976, the most wealthy 1% owned 21% of marketable wealth, and that in 2003 that figure was, er, 21%.  In 1976, what the Inland Revenue refer to as the "most" wealthy 50% owned 92% of marketable wealth, and in 2003 that figure was 93% (source: Inland Revenue).  This is not fast growth -- in fact both figures are in decline from their peak in round about 2000.

It is true that inequality in what the Inland Revenue calls "Marketable wealth less value of dwellings" (source as above) has increased -- though it is hard to reconcile with the figures Polly cites for "liquid assets".  Strip housing out of the wealth figures and the most wealthy 1% own 34% (and not 63%).  This is indeed up from 1976 (29%) but down from its peak in 2002.  The more wealthy 50% did indeed own 99%, up from 88% in 1976.

So, if overall wealth inequality is unchanged (and not infinitely escalating) but the inequality of ownership of assets less housing is getting more unequal, this must mean that inequality of housing wealth must be decreasing.

-o0o-

I also have a little trouble with this statement:

nearly 70% own their own homes

Nearly 70% of what?  Surely not people.  Adults?  Possibly.  Parents?  Well, maybe.  It is difficult to tell from the context.  According to the national statistics website:

70% of GB dwellings are owner-occupied

Which is quite a different proposition, given that there are about 2.4 people per household (source: follow the links here).

-o0o-

Compare the headline:

Cameron's set has no clue what middle England earns

And this statement of Polly's:

Do they know the median (middle England) salary is just £21,000?

Which rather raises the old conundrum about whether it is possible to know something that is wrong.  According to the Annual Survey of Hours and Earnings:

Median annual earnings for full-time employees for the 2004-05 tax year stood at £22,900

-o0o-

UPDATE: Much of what Polly writes about today, as if it were current, is in fact a couple of months out-of-date now.  So, for example:

George Osborne astonishingly claims that this modest tax change is "a wake-up call to middle England"

or

The Law Society had the effrontery to warn that this trust tax means 10m wills must be redrawn at a cost of £2.5bn. One insurance company said 4.5m life-assurance policies would need redrawing.

actually date from at least two months ago (source), before the government amended its proposals in June (source).  The changes tightened the scope of the proposals, thereby execluding many of the people who were so upset about the original proposals.  To claim that they are concerned about proposals which have been specifically tightened in order to reflect their concerns is at best inaccurate précis.

Saturday, July 01, 2006

Unsure conclusion

A delayed post about yesterday's column -- the result of a late flight and a heavy schedule.  Others have already pointed out that:

Remember, before Labour there was no childcare, no nursery education and no Sure Start to help young families

is of course twaddle, and that the evidence on Head Start is ambiguous (with a source, unlike, of course, Polly).

It is interesting that when writing about the research into the success of Sure Start, which produced a result which Polly didn't like, she writes:

Another batch will be out soon, unless some wise minister reconfigures it to measure only what can be measured.

When you have the courage to lecture this particular government on how to fix research to produce the desired as opposed to truthful answer, then you've left any pretense at accuracy behind.

So others have fact-checked the big stuff -- here's a mere crumb.  Polly writes:

At prime minister's questions this week, Margaret Moran stepped in to urge him "to join me in congratulating staff" at the 11th Sure Start to open in her Luton constituency. It obliged him to sing its praises for once. 
[emphasis added]

Compare this to Hansard:

Q7. [80673] Margaret Moran (Luton, South) (Lab): Is my right hon. Friend aware that one of my official engagements yesterday was the opening of the 11th children’s centre in my constituency, at a school, Dallow junior, which has received over £2 million of additional investment for new facilities? Will he join me in congratulating the staff involved in that achievement, and does he agree that it is another example of this Government tackling child poverty, which doubled under the Conservative party?
[emphasis added]

Children Centre is not synonymous with Sure Start -- it is just one of the Sure Start's mechanisms.  There is also, for example, the Early Excellence Centre.  There's one at Pastures Way Nursery in Luton, for example (source).

Doubtless this will strike many as pedantry -- this one little inaccuracy doesn't alter the broad thrust of the argument.  However, if she can't really do the simple stuff like summarising Hansard correctly, it is harder to take seriously the policy recommendations, the reporting of anecdotes that she relies on so heavily, and, of course, the ever-present criticism of others for inaccuracy and relying on anecdote.

Tuesday, June 27, 2006

Normal service resumed

In today's column, Polly writes that:

The government only just failed to pass the "incitement to religious hatred" bill because Blair himself accidentally failed to turn up to vote.

Actually, the Racial and Religious Hatred Act 2006 did receive royal assent on the 16 February 2006 (source).  The government lost a vote on a proposed compromise between the government's version of the bill and some Lords amendments on 31 January by a single vote.  An amendment, not the bill (source).

Of the UK, Polly writes:

the very small number of religious practitioners in this most secular of nations.

Social Trends 36, on page 200, says this:

Attendance at religious services varies across Europe. Figure 13.19 shows the percentage of individuals who attended a religious service irrespective of faith at least once a month for the EU nations surveyed. In 2002 the highest attendance was by people resident in Poland (75 per cent) and the lowest by people of Denmark (9 per cent). The countries with the highest rates of attendance all followed the Catholic or Orthodox religion, while the Protestant Scandinavian countries recorded the lowest rates. The United Kingdom is placed 13th with 19 per cent of residents attending religious services at least once a month.

Not even in Europe is the UK the "most secular of nations".

Friday, June 23, 2006

Despite

I clearly need to take more holidays.

As an anonymous commenter pointed out here, there was much fuss during the week about Polly's inaccurate attempt to criticise a critic -- see http://www.stephenpollard.net/002642.html.  Today brings a correction from the Guardian here:

In a column headed Britain is smiling, but it looks daggers at Labour, page 31, June 20, we accurately reported a blog posting by Janan Ganesh but incorrectly attributed to him the heading on the blog: "Let the Sudanese die - it's none of our business". The heading was not written by Mr Ganesh.

Like I said, maybe I should take more holidays?

Friday, June 16, 2006

Respite

FactcheckingPollyanna is on holiday until next Friday.